

Climate
Climate showcases the temperature changes, current status of national ENSO, rainfall, SSL and coral bleaching. This page also includes jump offs for relevant pages to climate.
Current Vanuatu Climate Status
8 Weeks Coral Bleaching Outlook up to 11 May 2026

The 8 weeks coral bleaching outlook shows that Vanuatu waters are light blue, which indicates a status of "No Stress". This means that, based on current forecasts, sea surface temperatures are not expected to reach levels that would harm the coral in these areas.
Current ENSO Status: Neutral state-(update for April 2026)

The 2025–26 La Niña has ended, increased chance of El Niño later in 2026.
VANUATU RAINFALL OUTLOOK: 28 MARCH TO 3 APRIL 2026

Above normal rainfall is likely for Torba, Sanma, Penama, Malampa and Shefa while Near normal rainfall for Tafea province.
WEEKLY TROPICAL CYCLONE OUTLOOK: 6th-12th April 2026
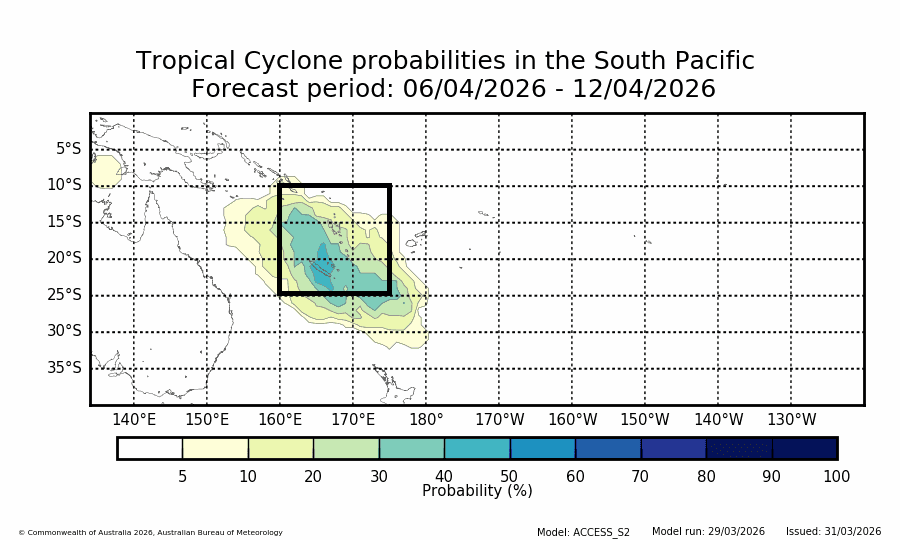
The possibilities for Tropical cyclone developing within the Vanuatu Area of Responsibility has increase to 10-50% for the week of 6th to 12th April.
Sectoral Climate Information Services
Climate Observation Stations

Climate Change Science Services
The Vanuatu Climate Futures Portal is a gateway to climate information services and tools, providing users with the science, mapping, data, videos and other resources to plan their adaptation actions. The Vanuatu Climate Futures Portal was developed by the GCF Vanuatu Klaemet Infomesen blong redy, adapt mo protekt (VanKIRAP) project.

Climate Mapping Tool
This interactive visualization tool allows you to select climate variables, greenhouse gas emissions pathways, time periods and locations to generate customised maps and datasets. You can visualise Area Council and Islands that are of interest to you.

Agriculture Mapping Tool
This interactive tool provides maps of current and future regions climatically suitable and diseases for Kava, Coffee, Cocoa, Taro and Yam using climate information services

Infrastructure Mapping Tool
This interactive visualisation tools allows you to map areas including roads and infrastructure inundation now and in the future (2030, 2050, 2070 and 2090) under various emission pathways

Fisheries Mapping Tool
This interactive visualisation tools allows you to map areas including Fisheries, Mangroves and Protected Areas. Users can also map historical and future marine heat waves

Tourism (Sea Level Rise) Mapping Tool
This interactive tool allows you to visualise sea level rise (current and future) for selected tourism pilot sites: Lonnoc Bamboo Beach, Lonnoc Beach Lodge, Lonnoc Ocean View Bungalows, Lonnoc Eco Beach Bungalows, Towoc Beach Bungalows, Champagne Beach and Towoc Beachfront Bungalows. Users can also visualise 10, 50 and 100 year return interval

Water (Extreme Flooding) Mapping Tool
This interactive mapping tool allows you to visualise extreme flooding areas in Efate (Mele Catchment) and Santo (Sarakata-Luganville Catchment) for 10, 50 and 100 year return intervals for low, medium and high emission scenarios.


